Causal Inference for Course Changes: Experiments vs Observational Studies
 Jul, 17 2026
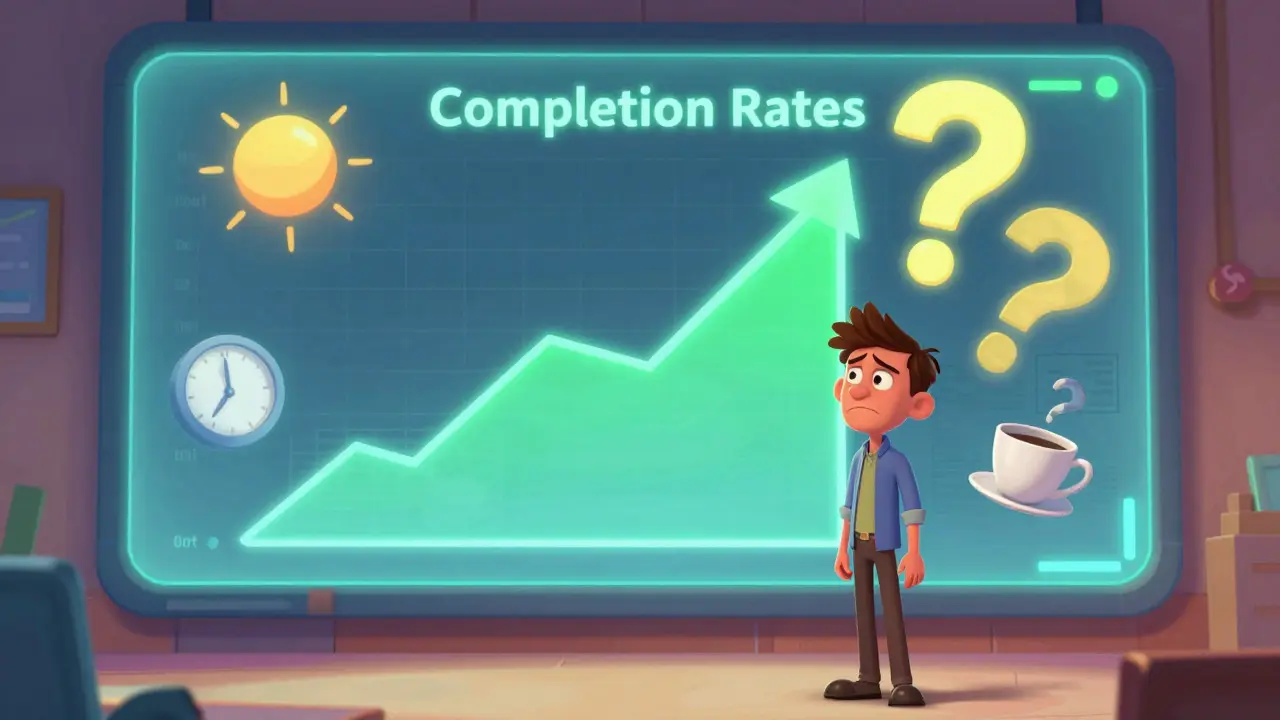
You just rolled out a new module in your online course. Completion rates jumped by 15%. Did your content work? Or did you just happen to launch it during summer break when students had more free time? This is the classic trap of course analytics. Without rigorous methods, we often mistake correlation for causation. We assume that because event B followed event A, A caused B. But in education, where human behavior is messy and influenced by countless external factors, that assumption can be dangerously wrong.
To truly understand what drives student success, we need to move beyond simple metrics and embrace causal inference. This field helps us answer not just "what happened," but "why it happened." The two main tools in this toolkit are randomized controlled experiments (A/B tests) and observational studies. Each has its place, but choosing the wrong one can lead to costly mistakes in curriculum design.
The Gold Standard: Randomized Controlled Trials
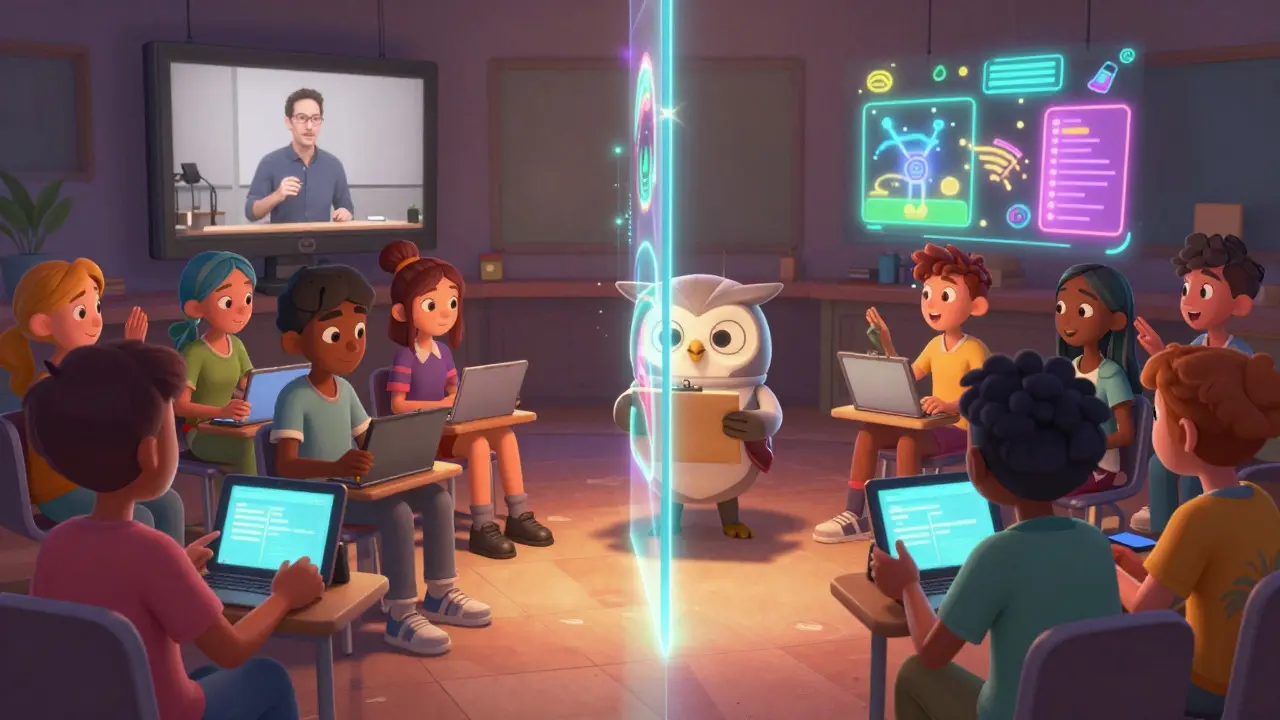
When people talk about proving cause and effect, they usually mean randomized controlled trials (RCTs). In an educational context, this looks like an A/B test. You split your student population into two groups. Group A gets the old video lecture format. Group B gets the new interactive simulation. Everything else-timing, instructor, assessment difficulty-remains identical.
Randomized Controlled Trial (RCT) is a scientific experiment where participants are randomly assigned to either a treatment group or a control group to measure the effect of an intervention. In course analytics, RCTs provide the highest level of evidence for causality because randomization balances out known and unknown confounding variables across both groups.
The beauty of randomization is that it neutralizes bias. If you worry that smarter students might self-select into the new module, random assignment solves that problem. By chance, both groups should have similar average GPAs, motivation levels, and prior knowledge. Any difference in final exam scores can then be attributed to the teaching method itself.
However, RCTs aren't always practical. They require significant traffic. If you only have 50 students in a niche advanced certification course, splitting them into two groups of 25 might not give you enough statistical power to detect a real difference. Plus, there’s the ethical question. Is it fair to withhold a potentially better learning experience from half your class just to gather data? Many educators hesitate to run true experiments on live students for fear of harming their learning outcomes.
The Reality Check: Observational Studies
In the real world, most course changes happen without formal experimentation. You update the syllabus based on feedback. You add a quiz because a colleague suggested it. Then you look at the data afterward. This is an observational study. You’re observing what naturally occurred without manipulating the environment.
Observational data is abundant. Your Learning Management System (LMS) logs every click, every pause, and submission. You have years of historical data. The challenge is that these data points are noisy. Students who choose to watch the optional bonus videos are likely more motivated than those who don’t. If you see higher grades among viewers, is it the videos or the motivation?
Confounding Variable is an outside influence that changes the effect of a dependent and independent variable. In course analytics, common confounders include student motivation, prior knowledge, socioeconomic status, and even the time of day a course is taken. Ignoring confounders leads to spurious correlations.
To make sense of observational data, analysts use statistical techniques to mimic randomization. Methods like Propensity Score Matching (PSM) help create comparable groups. For example, if you want to know if attending office hours improves grades, you can match each student who attended with a non-attending peer who had the same GPA, major, and class schedule. This creates a synthetic control group that approximates the balance found in an RCT.
While less definitive than experiments, observational studies are crucial for understanding long-term trends and rare events. You can’t wait five years to run an experiment to see how early coding skills impact career placement. You have to analyze existing longitudinal data. The key is acknowledging the limitations and using robust statistical controls.
Comparing Approaches: When to Use Which
Choosing between experiments and observational methods depends on your resources, timeline, and the specific question you’re asking. There is no one-size-fits-all solution. Here is a breakdown of how they stack up in practice.
| Feature | Randomized Experiment (A/B Test) | Observational Study |
|---|---|---|
| Causal Certainty | High (Gold Standard) | Medium (Depends on Controls) |
| Data Requirement | Large sample sizes needed | Works with smaller, historical datasets |
| Implementation Cost | High (requires platform support) | Low (uses existing LMS data) |
| Ethical Constraints | High (withholding benefits) | Low (no intervention required) |
| Best For | Testing specific UI/content changes | Understanding long-term trends & complex behaviors |
If you are tweaking a button color or testing two different email subject lines for reminders, an A/B test is perfect. It’s fast, cheap, and clear. But if you are trying to understand why students drop out after Week 3, an experiment won’t help much. You need to observe the patterns of those who left versus those who stayed, controlling for factors like workload and engagement.
Common Pitfalls in Educational Data Analysis
Even with the right method, pitfalls abound. One major issue is selection bias. In many online courses, students self-select into tracks. The "Advanced Python" cohort will naturally perform differently than the "Intro to Programming" cohort. Comparing their completion rates directly is meaningless. You must adjust for the baseline differences.
Another trap is the Hawthorne Effect. When students know they are part of an experiment, they may behave differently. They might pay closer attention simply because they feel observed. This can inflate the perceived effectiveness of a new teaching tool. Blinding participants-where they don’t know which version they are getting-helps mitigate this, though it’s hard to blind a completely redesigned course interface.
Data quality is also a silent killer. If your LMS doesn’t accurately track whether a video was actually watched or just loaded, your observational analysis will be flawed. Garbage in, garbage out. Ensure your tracking pixels and event logs are reliable before drawing conclusions.

Practical Steps for Implementing Causal Inference
You don’t need a PhD in statistics to start applying these concepts. Here is a practical roadmap for integrating causal thinking into your course analytics workflow.
- Define the Intervention Clearly: What exactly are you changing? Is it the content, the delivery method, or the assessment? Be specific. Vague interventions lead to vague results.
- Identify Potential Confounders: List everything that could influence the outcome besides your change. Prior knowledge, device type, internet speed, and motivation are all candidates.
- Choose the Method: Can you randomize? If yes, set up an A/B test. If no, plan an observational study with strong matching techniques.
- Pilot Test: Run a small-scale version first. Check for technical issues and ensure data is being captured correctly.
- Analyze with Care: Don’t just look at averages. Look at distributions. Did the new method help struggling students while hurting high achievers? Segment your data.
- Iterate: Causal inference is not a one-time event. Use insights to refine your hypothesis and test again.
For example, if you suspect that adding discussion forums increases engagement, start by identifying students who already participate heavily. Match them with non-participants of similar skill levels. Compare their retention rates over six months. If the gap persists, you have a strong case for investing in community-building features.
Future Trends in Course Analytics
As technology evolves, so do our analytical capabilities. Machine learning algorithms are making observational studies more powerful. Techniques like Double Machine Learning can automatically control for hundreds of confounding variables, reducing human error in model specification.
We are also seeing a shift toward continuous experimentation. Instead of annual curriculum reviews, leading institutions use multi-armed bandit algorithms that dynamically allocate students to different learning paths based on real-time performance. This blends the rigor of experiments with the flexibility of observational learning.
Privacy regulations like GDPR and FERPA continue to shape how we collect and use data. Anonymization techniques must be robust to protect student identity while preserving the utility of the data for analysis. Balancing privacy with insight is the next frontier in educational analytics.
What is the difference between correlation and causation in course analytics?
Correlation means two variables move together, like ice cream sales and drowning incidents. Causation means one variable directly influences the other. In course analytics, just because students who watch videos get higher grades doesn’t mean videos cause higher grades. Motivated students might do both. Causal inference methods help isolate the true cause.
When should I use an A/B test instead of an observational study?
Use an A/B test when you can randomly assign students to different conditions and have enough participants to achieve statistical significance. It’s best for testing specific, isolated changes like button colors, email copy, or short content modules. Use observational studies when randomization is impossible or unethical, or when analyzing long-term historical trends.
How do I handle confounding variables in observational data?
You can handle confounders by using statistical techniques like regression adjustment, propensity score matching, or instrumental variables. These methods attempt to simulate the balance found in randomized experiments by statistically controlling for known differences between groups, such as prior GPA or demographic factors.
Is it ethical to run A/B tests on students?
It can be ethical if done responsibly. Key principles include ensuring that no group is harmed, obtaining informed consent where possible, and debriefing participants afterward. Avoid withholding proven effective interventions. Small-scale tests on low-stakes elements like navigation menus are generally considered low-risk.
What tools are best for causal inference in education?
Popular tools include R packages like 'MatchIt' and 'CausalInference', Python libraries such as 'DoWhy' and 'EconML', and specialized platforms like Optimizely for A/B testing. For LMS-specific analysis, SQL combined with Python or R allows for deep custom modeling of student interaction data.