Linking Learning Analytics to Performance KPIs in Business
 Feb, 22 2026
Most companies track sales numbers, customer retention, and operational costs. But how many track whether their training actually moves the needle on real business results? Too often, learning programs are measured by completion rates or quiz scores-metrics that tell you nothing about whether employees are doing their jobs better. The gap between learning and performance is real, and it’s costing businesses money. When training doesn’t connect to KPIs, you’re not investing in people-you’re just checking a box.
Why Learning Analytics Alone Isn’t Enough
Learning analytics tracks what happens inside a course: who finished, how long they spent, where they got stuck. That’s useful, but it’s like watching a car’s dashboard while ignoring the road. You can see the engine is running, but you don’t know if the car is getting to its destination.
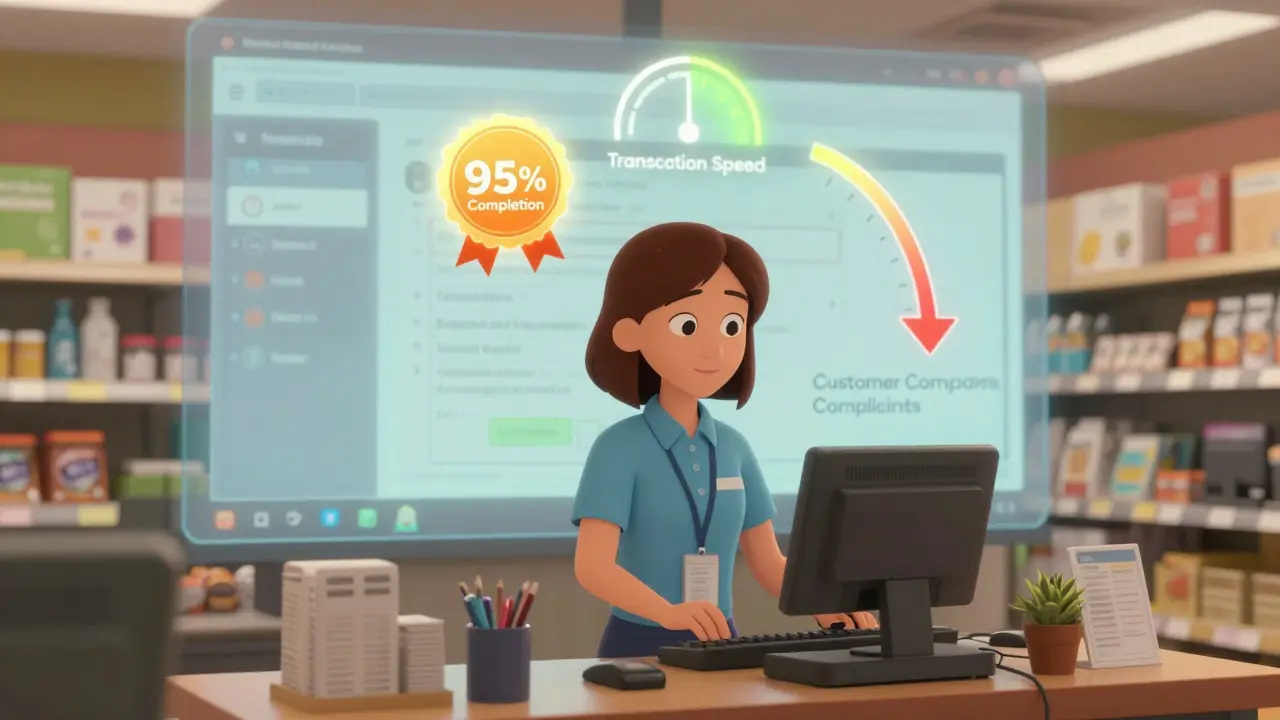
Take a retail company that trains cashiers on new point-of-sale software. If 95% complete the module, does that mean they’re processing transactions faster? Are returns being handled correctly? Are customer complaints dropping? Without linking those training metrics to actual job performance, you’re flying blind.
Real learning analytics for business needs to answer one question: Did this training change behavior in a way that improved outcomes?
How to Connect Training to KPIs
The process is simpler than most think. Start with your business goals. What are the top three metrics your team is measured on? For customer service reps, it might be first-call resolution rate. For warehouse staff, it could be order accuracy. For sales reps, it’s conversion rate or deal velocity.
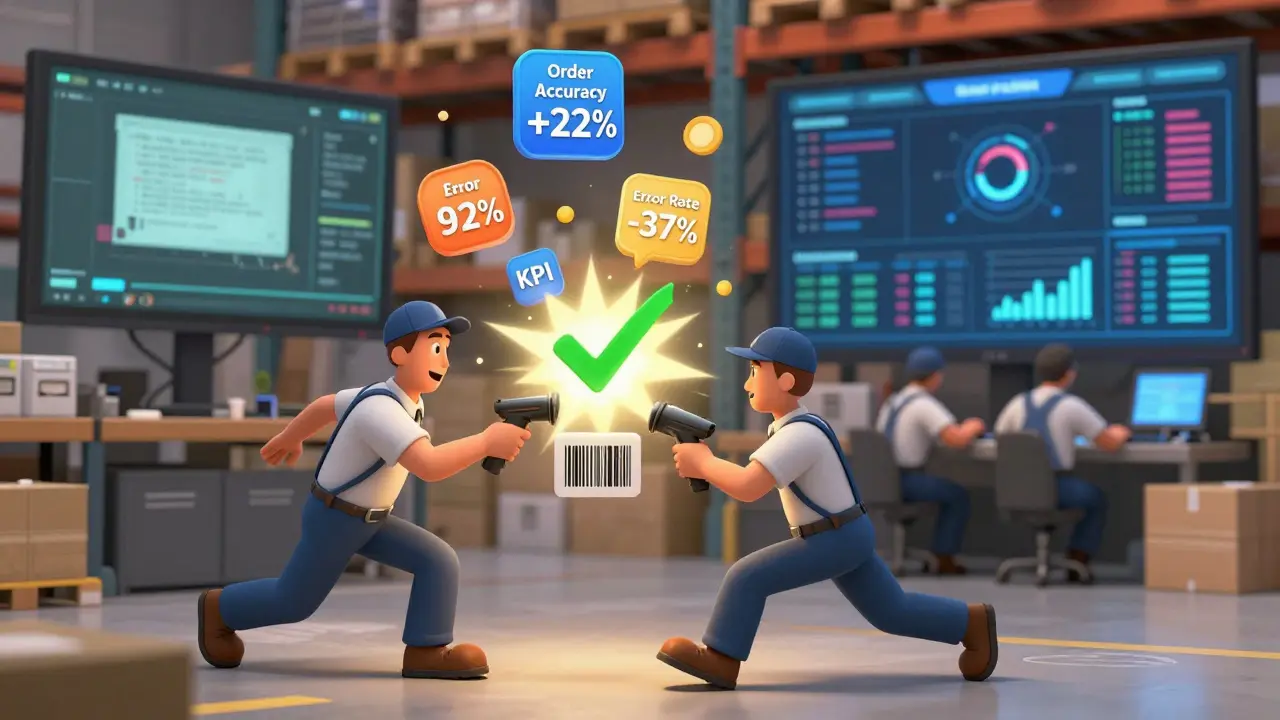
Now map your training to those KPIs. If you’re training sales reps on objection handling, you should be able to measure whether their conversion rate improved 30 days after the training. If you’re training warehouse staff on barcode scanning, you should track error rates before and after.
Here’s how to do it step by step:
- Identify the KPI you want to move (e.g., reduce customer complaints by 20%).
- Find the training program that directly supports that KPI (e.g., communication skills module for frontline staff).
- Collect baseline data on the KPI before training starts.
- Track completion and engagement during training using your LMS.
- Measure the same KPI 30-60 days after training ends.
- Compare the numbers. If the KPI improved, you’ve proven ROI. If not, you’ve got a problem to fix.
This isn’t guesswork. It’s data-driven decision-making. Companies like Amazon and Walmart use this method to scale training across hundreds of locations. They don’t care if someone watched a video-they care if their inventory shrinkage dropped because employees followed new procedures.
Real Examples That Worked
A mid-sized healthcare provider in Arizona trained nurses on electronic health record updates. Before the training, documentation errors caused 18% of patient delays. After training, they tracked error rates for three months. The number dropped to 6%. That’s not just better training-that’s fewer missed appointments, happier patients, and higher staff satisfaction.
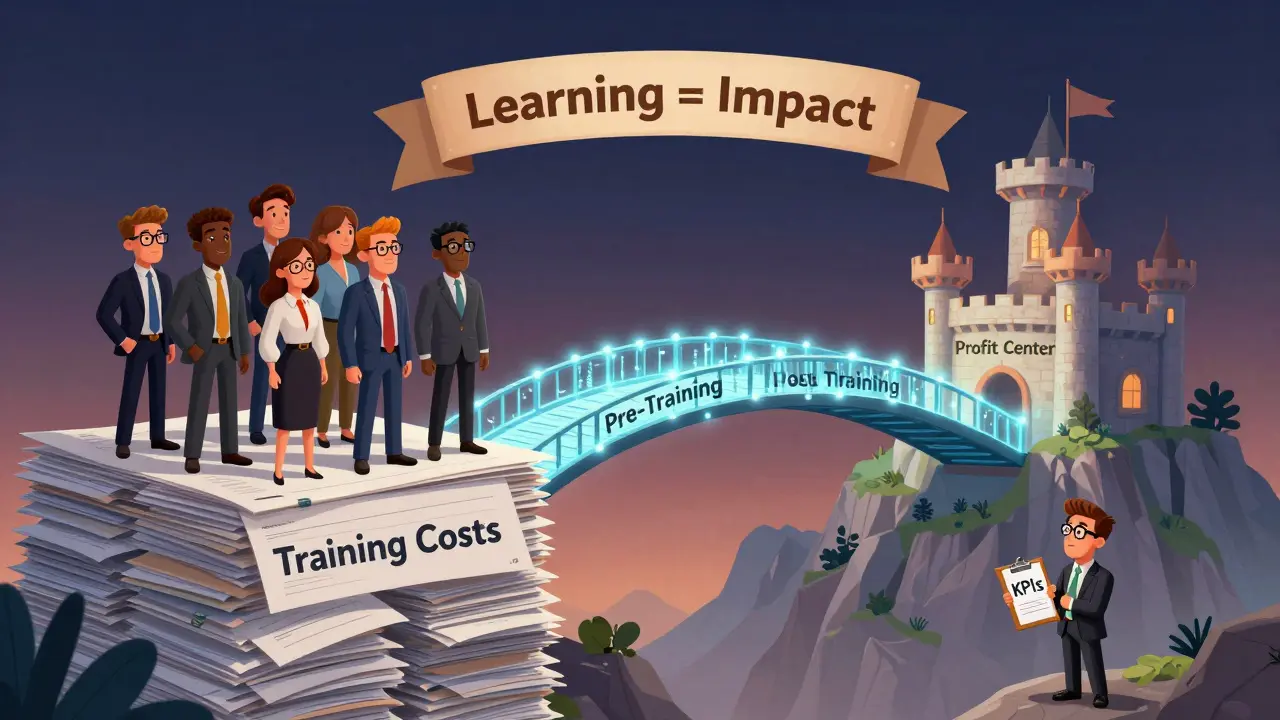
A logistics firm in Texas trained drivers on fuel-efficient routing. They didn’t just measure course completion. They pulled telematics data from their fleet. Fuel costs per mile dropped 12% in the first quarter after training. That’s $280,000 saved in one year. The training wasn’t just a compliance requirement-it became a profit center.
These aren’t outliers. They’re examples of companies that stopped measuring activity and started measuring impact.
Common Mistakes to Avoid
Many organizations try to link learning to KPIs but fail because they make the same mistakes:
- Measuring the wrong KPI. Training on product knowledge? Don’t track quiz scores-track upsell revenue.
- Waiting too long to measure. If you wait six months, you can’t tell if the training caused the change. Use 30-60 days.
- Ignoring confounding factors. Did sales improve because of training, or because marketing ran a new campaign? Control for outside variables.
- Only looking at averages. If 80% of employees improved but 20% got worse, you need to dig deeper. Who’s falling behind? Why?
The most dangerous mistake? Assuming correlation equals causation. Just because training happened and KPIs improved doesn’t mean one caused the other. That’s why you need baseline data and controlled comparisons.
Tools That Make This Easier
You don’t need a fancy AI system. Most modern LMS platforms-like Cornerstone, Workday, or even Moodle with plugins-can export user data. Combine that with your HRIS (like SAP SuccessFactors or BambooHR) and your CRM (Salesforce, HubSpot). You can build simple dashboards in Excel or Google Sheets to compare training completion with performance changes.
For larger companies, platforms like Degreed or Workday Learning integrate directly with performance systems. They can show you, for example, that employees who completed the leadership module were 40% more likely to be promoted within a year.
The key isn’t the tool-it’s the habit of asking: Did this learning change what people do?
What Happens When You Don’t Link Them?
Without this connection, training becomes invisible. Managers don’t see its value. Budgets get cut. Employees tune out. You end up with a training program that feels like a chore, not a competitive advantage.
One manufacturing plant in Ohio spent $150,000 a year on safety training. Completion rates were 100%. But workplace injuries stayed flat. When they finally linked training data to incident reports, they found the module on lockout-tagout procedures was outdated. The video hadn’t been updated since 2018. Once they fixed it and tracked injury rates again, incidents dropped by 45% in six months.
That’s the power of linking learning to performance. It doesn’t just prove ROI-it makes training better.
Start Small. Think Big.
You don’t need to overhaul your entire learning program tomorrow. Pick one KPI. Pick one team. Pick one training module. Measure before. Measure after. Compare. Adjust. Repeat.
That’s how organizations build a culture of evidence-based learning. Not with fancy dashboards or expensive consultants. With simple, honest data.
When learning analytics speaks the language of business KPIs, training stops being a cost center. It becomes a driver of growth, safety, efficiency, and profit.
How do I know which KPI to link to my training program?
Start with your team’s core responsibilities. If they’re in sales, look at conversion rates, average deal size, or renewal rates. If they’re in customer service, track first-contact resolution, CSAT scores, or call handling time. For operations, measure error rates, cycle times, or equipment downtime. The KPI should be something your team directly influences and that leadership already tracks.
How long should I wait to measure KPI changes after training?
Wait at least 30 days, but 60 days is better. It takes time for new skills to become habits. If you measure too soon, you’re seeing short-term enthusiasm, not lasting change. For complex skills like leadership or technical troubleshooting, 90 days may be necessary.
Can small businesses use this approach?
Absolutely. You don’t need a big budget or fancy software. Use free tools like Google Sheets to track pre- and post-training performance. For example, if you train your team on invoicing, track how many invoices get paid on time before and after. That’s all you need to prove value.
What if training doesn’t improve the KPI?
That’s not failure-it’s insight. It means your training isn’t aligned with the problem. Maybe the content is outdated. Maybe the delivery method doesn’t work for your team. Maybe the real issue is tools, not knowledge. Use that data to redesign the program instead of just repeating it.
Is this only for corporate training?
No. Any team that performs work can benefit. Retail staff, technicians, field workers, even freelance contractors. If someone’s performance affects your business results, linking their training to measurable outcomes makes sense. It’s not about size-it’s about impact.