Dashboards for Instructors: Visualizing Assessment Data
 Nov, 16 2026
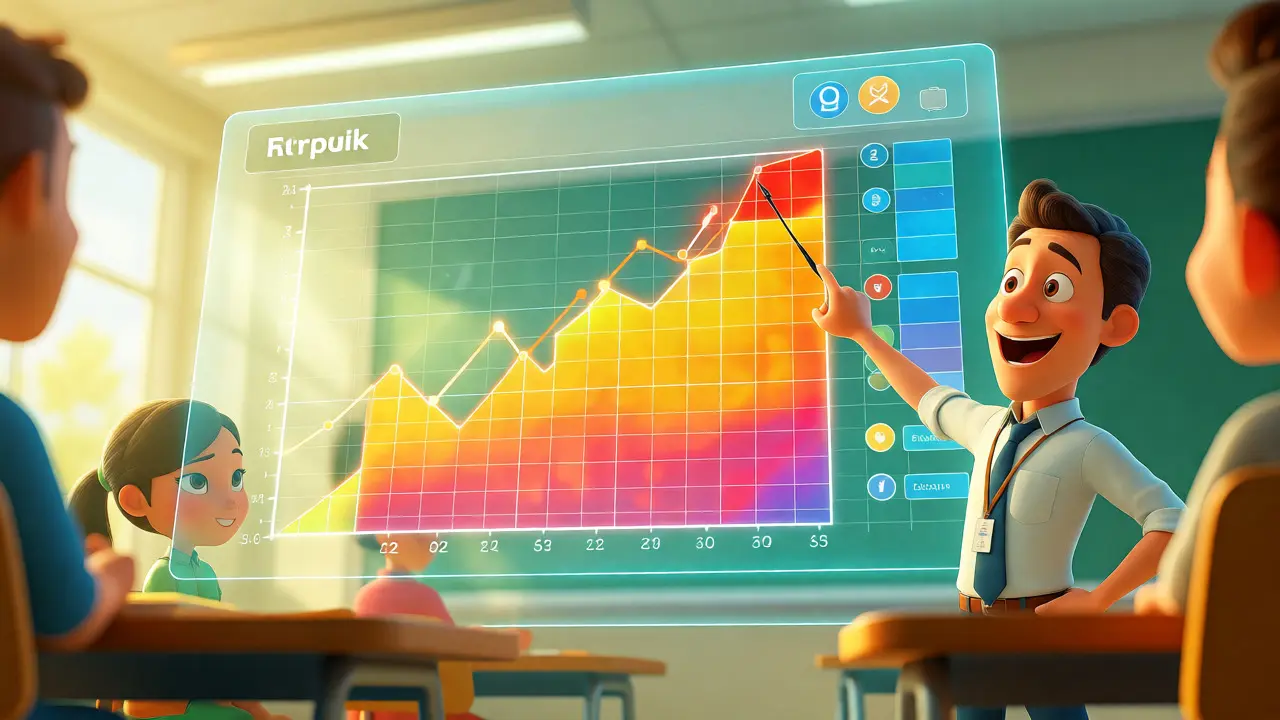
You’ve just finished grading a stack of quizzes. Your spreadsheet is a mess of red and green cells. You know who failed, but do you know why? Or which specific concept tripped up half the class? Most instructors drown in raw numbers while starving for insight. That’s where assessment dashboards come in. These tools turn cold data into visual stories, helping you spot trends before they become failures.
If you’re still manually calculating averages or squinting at CSV files, you’re wasting time that could be spent teaching. A good dashboard doesn’t just show you grades; it shows you learning behaviors. It highlights patterns invisible to the naked eye. Let’s break down how to build, read, and act on these visuals so you stop guessing and start knowing.
Why Raw Grades Aren’t Enough
A final grade tells you the destination, not the journey. If a student scores 65% on a midterm, that number hides critical context. Did they struggle with the first three questions (conceptual gaps) or the last five (time management)? Traditional gradebooks rarely answer this. They aggregate results, smoothing out the spikes and dips that matter most for intervention.
Data visualization solves this by mapping performance against time and topic. Instead of one big number, you see a heat map of question difficulty. You might notice that Question 4 has an 80% error rate across all sections. That’s not a student problem; that’s an instructional design problem. Maybe your explanation was unclear, or the wording was tricky. Spotting this early lets you reteach the concept next week, rather than watching students fail the final exam.
Consider the difference between reactive and proactive teaching. Reactive means waiting until midterms to see who is struggling. Proactive means seeing a drop in quiz engagement on Tuesday and sending a nudge email on Wednesday. Dashboards enable this shift from autopsy to health checkup.
Core Components of an Effective Instructor Dashboard
Not all dashboards are created equal. Some are pretty but useless; others are ugly but actionable. The best ones balance clarity with depth. Here’s what you actually need to see, stripped of the fluff.
- Progress Over Time: Line graphs showing average scores per assessment. Are scores trending up or down? A downward slope after Week 3 often signals increasing complexity without adequate scaffolding.
- Item Analysis: Bar charts displaying correct vs. incorrect answers per question. This identifies "bad" questions-those with near-random distribution (50/50 split) usually indicate ambiguity.
- Engagement Metrics: Login frequency, assignment submission times, and resource views. Students who submit assignments at 11:59 PM consistently tend to perform worse than those who work incrementally.
- Cohort Comparisons: Side-by-side views of different sections or years. If Section A averages 75% and Section B averages 60%, is it the students or the delivery?
Don’t overload the view. If you have fifteen widgets, you’ll look at none of them. Stick to the "Big Four": Performance Trend, Concept Mastery, Engagement, and Risk Flags. Anything else belongs in a drill-down menu.
Choosing the Right Visualization Type
How you display data changes how you interpret it. Using the wrong chart can mislead even the sharpest instructor. Here’s a quick guide to matching the metric to the visual.
| Data Goal | Best Visualization | Why It Works |
|---|---|---|
| Trends over time | Line Chart | Shows directionality and velocity of change clearly. |
| Distribution of scores | Histogram | Reveals skewness, outliers, and bimodal clusters (e.g., two distinct groups). |
| Topic mastery | Heat Map | Uses color intensity to highlight weak areas across many students quickly. |
| Question difficulty | Bar Chart | Easy comparison of error rates side-by-side. |
| Student risk status | Scatter Plot | Plots engagement vs. performance to identify "silent strugglers." |
For example, use a histogram when you want to see if your class is polarized. If you see two peaks-one high, one low-you likely have a knowledge gap issue where advanced students are bored and beginners are lost. A simple average would hide this entirely.
Integrating LMS Data with External Tools
Most Learning Management Systems (LMS) like Canvas, Blackboard, or Moodle have built-in analytics. But let’s be honest: they’re often basic. They give you logs, not insights. To get real power, you might need to export data to external tools.
Power BI and Tableau are heavy hitters here. They allow you to merge LMS data with other sources, like library usage or attendance records. Imagine correlating library book checkouts with essay grades. Do students who use more resources score higher? Tableau makes this link visible in seconds.
However, don’t ignore native plugins. Many LMS providers now offer third-party integrations like EdTech analytics platforms such as Civis Analytics or specialized ed-tech startups. These often provide pre-built dashboards tailored for education, saving you from building everything from scratch. Start with what your institution already licenses. If your school pays for Microsoft 365, Power BI is likely free and powerful enough for most classroom needs.
Actionable Insights: From Data to Intervention
Seeing a red flag is useless if you don’t know what to do about it. The goal isn’t to admire the chart; it’s to change the outcome. Here’s how to translate common dashboard alerts into teaching moves.
Alert: High variance in scores. If your histogram shows a wide spread, differentiation is failing. You’re teaching to the middle, leaving both ends behind. Action: Create tiered assignments. Offer optional deep-dive problems for high scorers and scaffolded worksheets for those below the mean.
Alert: Sudden drop in engagement. A dip in logins or submissions often precedes a grade drop. Action: Send personalized emails. Don’t blast the whole class. Message only the 10 students whose activity dropped >50%. Ask a simple question: "Is there a barrier preventing you from logging in this week?" Response rates are surprisingly high.
Alert: Specific question failure. If 70% of the class missed Question 3, don’t just re-grade. Action: Pause the next lecture. Spend ten minutes reviewing that specific concept. Use a live poll to check understanding immediately. This closes the loop between assessment and instruction.

Pitfalls to Avoid When Building Dashboards
Educators love data, but we also love overcomplicating it. Here are the traps that kill dashboard utility.
- Vanity Metrics: Total page views sound impressive but mean little. Focus on meaningful actions, like completing practice problems or attending office hours.
- Lack of Context: A score of 70% is bad in a rigorous physics class but great in an introductory art history survey. Always benchmark against course-specific baselines, not global standards.
- Static Reports: PDFs are dead. If your dashboard doesn’t update automatically, you’re looking at old news. Ensure your data pipeline refreshes daily or weekly.
- Privacy Blind Spots: Be careful sharing granular data publicly. Aggregate views protect student identity better than individual rows, especially in small classes.
Also, beware of "analysis paralysis." If you spend more time tweaking colors than talking to students, you’ve gone too far. The dashboard should take less than five minutes to review each week. If it takes longer, simplify it.
The Future: Predictive Analytics in Education
We’re moving beyond descriptive analytics (what happened) toward predictive analytics (what will happen). Modern AI-driven tools can now forecast student success based on early semester behavior. For instance, if a student misses two consecutive quizzes and hasn’t logged in for four days, the system predicts a high risk of failure with 85% accuracy.
This shifts the role of the instructor from grader to coach. You’re no longer reacting to failures; you’re preventing them. Platforms like Knewton or adaptive learning engines within major publishers are already doing this. As these tools become cheaper and easier to integrate, the ability to visualize and predict assessment outcomes will become a standard expectation, not a luxury feature.
Start small. Pick one course. Export your last three assessments. Build a simple line chart of average scores. Look for one anomaly. Investigate it. Teach to it. That’s how you master assessment data visualization.
Do I need coding skills to create assessment dashboards?
No, not necessarily. While SQL or Python helps with custom queries, tools like Excel, Google Sheets, Tableau Public, and Power BI offer drag-and-drop interfaces. Most modern LMS platforms also have built-in reporting features that require zero coding. Start with what you know; you can always upgrade later.
How often should I check my dashboard?
Weekly is ideal for active courses. Checking daily can lead to anxiety over minor fluctuations, while checking monthly is too slow for timely intervention. Set a recurring calendar block-say, Friday mornings-to review trends and plan next week’s adjustments.
What is the biggest mistake instructors make with data?
Confusing correlation with causation. Just because students who watch videos get higher grades doesn’t mean watching videos causes higher grades. They might simply be more motivated. Use data to ask questions, not to prove assumptions. Validate findings with direct observation or student feedback.
Can dashboards help with accreditation reports?
Absolutely. Accreditation bodies often require evidence of continuous improvement. Dashboards provide longitudinal data showing how curriculum changes impacted student outcomes over multiple semesters. Automated exports save hours during audit seasons compared to manual compilation.
Is student privacy a concern with detailed analytics?
Yes, under laws like FERPA in the US. Ensure your dashboard provider complies with data protection regulations. Avoid sharing identifiable data outside the institution. When presenting to peers or administrators, anonymize data or use aggregated cohorts unless explicit consent is given.
Taylor Lewis
November 16, 2026 AT 18:48Standard pedagogical fluff. We have known about item analysis since the 80s.