How to Build a Learning Data Warehouse from LMS and LRS Sources
 Mar, 24 2026
Most schools and companies collect tons of learning data-but few know how to turn it into something useful. You’ve got data from your LMS-course completions, quiz scores, login times-and maybe even from an LRS that tracks everything from video views to forum posts. But if that data sits in separate silos, it’s just noise. What if you could combine it all into one clear picture of how people learn? That’s what a learning data warehouse does. And building one isn’t as complicated as you think.
Why a Learning Data Warehouse Matters
Think of your LMS like a smartphone. It tracks basic usage: who logged in, what course they took, did they pass the test. That’s helpful. But it doesn’t tell you if someone watched a video twice because they were confused, or if they skipped a module because it was too slow. That’s where the LRS comes in. An LRS (Learning Record Store) follows the xAPI standard and records fine-grained interactions: clicking a simulation, sharing a resource, pausing a video, even using a chatbot for help.
When you merge these two sources, you start seeing patterns. For example, a company noticed that learners who spent over 12 minutes on a compliance video were 40% more likely to pass the follow-up assessment. Without combining LMS and LRS data, they’d never have spotted that. That’s the power of a learning data warehouse: it turns scattered signals into actionable insights.
What You Need to Get Started
You don’t need a team of data scientists or a $500K budget. Here’s what you actually need:
- An LMS that exports data (Canvas, Moodle, Blackboard, or Cornerstone all do)
- An LRS that accepts xAPI statements (Tin Can API). Options include Watershed, Learning Locker, or even a self-hosted instance
- A data warehouse-something like Google BigQuery, Snowflake, or even PostgreSQL. You’re not building a data lake. Just a clean, structured place to store and query learning data
- Basic SQL skills. You don’t need Python or machine learning. Just know how to join tables, filter dates, and group results
Most organizations already have two of these. The missing piece is usually the warehouse itself. And that’s the easiest part to fix.
Step-by-Step: Pulling Data from LMS and LRS
Here’s how to connect the dots, step by step.
- Export LMS data. Most LMS platforms offer CSV or API exports. Look for fields like user ID, course ID, completion status, start/end dates, scores. If your LMS doesn’t have an API, use its reporting tools to generate weekly CSVs.
- Set up xAPI from your LRS. If you’re using an LRS, it already collects statements. But you need to pull them out. Use the LRS’s API endpoint (usually something like
https://yourlrs.com/xapi/statements). You’ll need an API key and to set up a scheduled job to pull new statements daily. - Standardize identifiers. This is the most common mistake. Your LMS uses
user12345. Your LRS usesurn:uuid:abc-123. You need a mapping table. Create a simple CSV with two columns: LMS ID and LRS ID. Update it monthly. Without this, you can’t link a user’s quiz score to their video pause behavior. - Load into your warehouse. Use a tool like Fivetran, Stitch, or a simple Python script with
requestsandpsycopg2to load the data. Don’t over-engineer this. Just get the data in. Clean it later. - Build your first view. Create a table that joins LMS completion records with LRS interaction data. Add columns like total_video_time, forum_posts, quiz_attempts. Now you have one row per learner per course.
After two weeks, you’ll have a working dataset. Not perfect. But usable.

What You Can Measure Once It’s Connected
Once your warehouse is running, you can answer questions you didn’t even know you had.
- Which modules cause drop-offs? Compare completion rates with video engagement. If 80% of learners finish a module but only 30% watch the entire video, that video needs to be shorter or broken into chunks.
- Who’s at risk of failing? Learners who take more than three quiz attempts and spend under 5 minutes on the content are 7x more likely to fail. Flag them for coaching.
- Do peer discussions help? Learners who post in forums have 22% higher final scores-even if they don’t get replies. Encourage discussion.
- Is mobile learning effective? Track if learners who complete courses on mobile devices score differently than desktop users. One university found mobile learners scored 14% lower on complex problem-solving tasks.
You’re not just reporting. You’re predicting. And that changes how you design learning.
Common Pitfalls and How to Avoid Them
People think data warehouses are magic. They’re not. They’re just organized data. But here’s where most projects fail:
- Trying to automate everything upfront. Start with weekly manual exports. Automate only after you’ve validated the data works.
- Ignoring metadata. You need to know who created a course, when it was last updated, which department owns it. Otherwise, you can’t filter results meaningfully.
- Forgetting privacy. Learning data is personal. Don’t store full names. Use anonymized IDs. Comply with FERPA, GDPR, or your local regulations. Don’t assume your LRS handles this for you.
- Chasing shiny metrics. Don’t track “number of clicks.” Track “number of clicks followed by a correct answer.” Context matters.
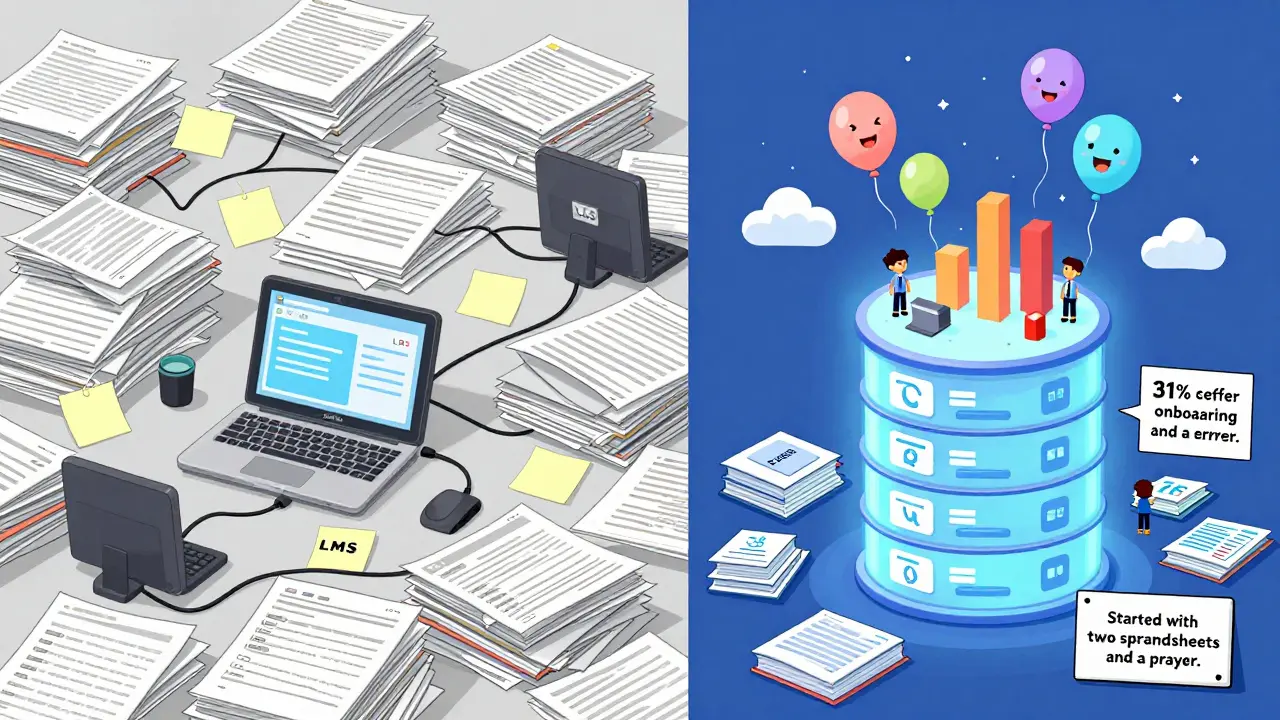
One client spent six months trying to integrate 12 systems. They gave up. Another started with two CSV files and one SQL query. Six weeks later, they had a dashboard showing which training reduced onboarding errors by 31%. The second team won.
Tools That Actually Work (No Fluff)
You don’t need expensive platforms. Here’s what real teams use in 2026:
| Tool | Best For | Cost | Learning Curve |
|---|---|---|---|
| PostgreSQL | Small teams, self-hosted, budget-conscious | Free | Low |
| Google BigQuery | Cloud-based, scalable, integrates with Sheets | $5/mo min | Medium |
| Watershed | Pre-built dashboards, LRS + analytics | $10k+/yr | Low |
| Python + Pandas | Custom ETL, if you have a developer | Free | High |
For most organizations, start with PostgreSQL or BigQuery. Use Watershed only if you’re already spending six figures on LMS licenses. Don’t pay for a tool that does what you can do with SQL.
What Comes Next
Once your warehouse is live, you’ll want to build dashboards. Start simple: one chart showing course completion vs. engagement. Share it with your training team. Watch their reactions. They’ll start asking questions you didn’t expect.
Then, connect it to your HR system. See if learners who complete leadership training get promoted faster. Or if customer support staff who finish conflict resolution modules have lower complaint rates. That’s when learning stops being a cost center-and becomes a strategic lever.
You’re not building a data warehouse to impress IT. You’re building it to help people learn better. And that’s worth doing-even if you start with two spreadsheets and a prayer.
Do I need an LRS to build a learning data warehouse?
You can build a basic version without an LRS, but you’ll miss half the story. An LMS tells you what happened. An LRS tells you how it happened. If you only use LMS data, you’ll see that 70% of learners completed a course. But you won’t know if they watched every video, skipped the quiz, or clicked through in 3 minutes. That’s why an LRS is essential for meaningful insights.
Can I use Excel instead of a data warehouse?
You can, for a few hundred users. But Excel breaks when you hit 50,000 rows or need to join data from two sources. It’s slow, error-prone, and doesn’t handle updates well. If you’re serious about learning analytics, use a real database. PostgreSQL or BigQuery can handle millions of records and let you run queries in seconds. Excel is for quick checks-not long-term analysis.
How often should I update the data?
Daily is ideal, but weekly works fine for most teams. If you’re tracking real-time behavior (like live simulations), go daily. If you’re measuring end-of-course outcomes, weekly is enough. The key is consistency. Don’t update it once a month and expect accurate trends. Data decays fast in learning.
Is this only for large companies?
No. A community college with 5,000 students built one using free tools and got results in six weeks. A nonprofit with 200 staff used it to cut their onboarding time by 40%. You don’t need a big budget. You need a clear question: ‘What do I want to learn from this data?’ Start there.
What if my LMS doesn’t support APIs?
Many older LMS platforms only export CSVs. That’s okay. Set up a weekly export. Use a free tool like Google Apps Script or a simple Python script to auto-download and load the file into your database. You lose real-time updates, but you still get trends. And trends are what matter most in learning analytics.
Final Thought
You don’t need AI, fancy dashboards, or a data science team. You need to stop treating learning data like trash. It’s not just logs-it’s evidence of how people learn. Start small. Connect two sources. Ask one question. See what you find. The rest will follow.
Liam Hesmondhalgh
March 25, 2026 AT 01:00Patrick Tiernan
March 25, 2026 AT 11:24Patrick Bass
March 25, 2026 AT 17:23Tyler Springall
March 25, 2026 AT 19:13Amy P
March 26, 2026 AT 19:20Ashley Kuehnel
March 28, 2026 AT 00:18adam smith
March 29, 2026 AT 09:56Mongezi Mkhwanazi
March 30, 2026 AT 03:28Mark Nitka
March 30, 2026 AT 14:43Kelley Nelson
March 31, 2026 AT 20:05Aryan Gupta
April 1, 2026 AT 09:33Fredda Freyer
April 1, 2026 AT 19:58