Learning Analytics for Courses: Data-Driven Improvement Strategies
 Nov, 21 2025
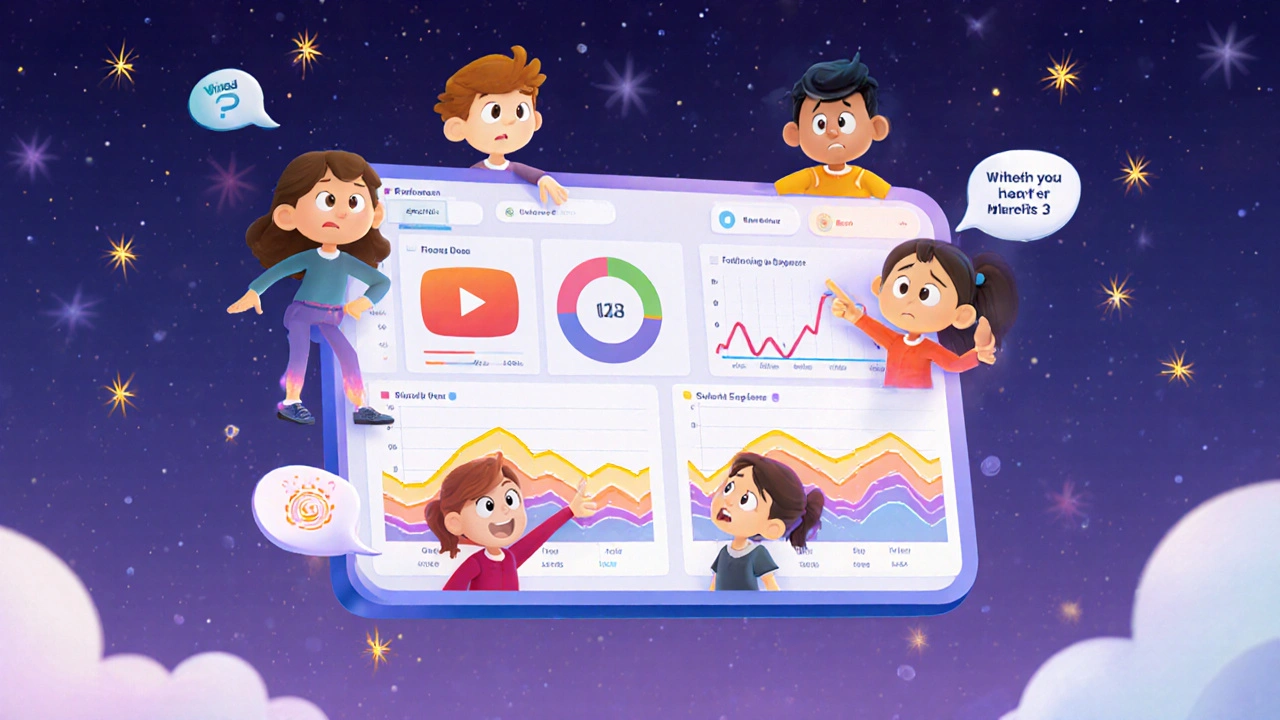
Most online courses fail not because the content is bad, but because no one knows what’s actually working. Instructors teach from intuition, students drop out for unknown reasons, and platforms track clicks but miss the real signals. Learning analytics changes that. It’s not about gathering more data-it’s about asking the right questions and acting on what the data reveals.
What Learning Analytics Really Means
Learning analytics is the measurement, collection, analysis, and reporting of data about learners and their contexts. It’s not just dashboards with red and green lights. It’s understanding why a student pauses on a video for 47 seconds, why 60% of learners skip the quiz after module three, or why participation spikes after a peer discussion prompt.
At its core, learning analytics connects behavior to outcomes. Did students who watched the supplemental case study score higher on the final? Did those who posted in the forum complete the course at twice the rate? These aren’t guesses-they’re patterns you can see if you look closely enough.
Platforms like Canvas, Moodle, and Blackboard already collect this data. The problem isn’t access-it’s interpretation. Most instructors don’t know how to turn logs into action.
Five Key Metrics That Actually Matter
Not all data is useful. Here are the five metrics that consistently predict course success-and where to find them:
- Engagement depth: Not just login frequency, but time spent on core content, number of resources accessed per module, and replay rate of instructional videos. A student who watches the same 8-minute lecture three times is struggling. A student who skips all videos but scores 95% on assessments? They might already know the material.
- Assignment latency: How long between when an assignment is released and when it’s submitted. Consistently late submissions in a specific module? That’s a red flag. The content might be too complex, poorly explained, or missing scaffolding.
- Forum contribution quality: Count replies, but also measure response length, use of course terminology, and peer feedback. A student who writes, “I agree,” isn’t engaging. One who says, “I tried this approach from Module 2 and it didn’t work because…” is demonstrating synthesis.
- Dropout clustering: Where do students leave? If 70% quit after the first graded quiz, the problem isn’t motivation-it’s assessment design. Is the quiz too hard? Too vague? Does it test memory instead of understanding?
- Completion vs. performance correlation: Do students who finish the course perform better on the final? Or do high performers drop out because they’re bored? If there’s no link, your course isn’t building skills-it’s just checking boxes.
These metrics aren’t theoretical. A 2024 study of 12,000 learners across six universities showed that courses using these five metrics improved completion rates by 34% in one semester, simply by adjusting pacing and support.
How to Use Data to Fix Your Course
Once you see the patterns, here’s how to respond:
- Low engagement in Module 3? Break it into two smaller parts. Add a quick self-check quiz halfway through. Students don’t quit because they’re lazy-they quit when they feel lost.
- High dropout after the first quiz? Don’t make it easier. Make it clearer. Add an ungraded practice quiz with detailed feedback. Show learners exactly what they need to know before the real one.
- Forum activity is flat? Stop asking, “What do you think?” Start asking, “Compare your solution to Sarah’s. What’s different?” Structured prompts drive deeper thinking.
- High performers are leaving? Add optional challenge modules. Offer a badge for applying concepts to real-world problems. Give them something to stretch into.
One instructor at Arizona State University noticed students were spending under 10 minutes on a module about financial modeling. Instead of assuming disinterest, she pulled the analytics: 82% of those students had failed the prerequisite math course. She added a 5-minute refresher video with real examples from accounting. Completion in that module jumped from 41% to 89%.

Common Mistakes That Waste Data
Most learning analytics efforts fail because of these errors:
- Measuring activity, not learning: Clicks don’t equal understanding. Watching a video twice doesn’t mean mastery-it means confusion.
- Reacting too fast: One bad week doesn’t mean the course is broken. Look for trends over time. Is the issue recurring or just a blip?
- Ignoring the quiet students: The ones who never post, never ask questions, but turn in perfect work? They’re your hidden success story. Find out what they’re doing right.
- Not sharing insights with learners: Tell students: “We noticed many of you struggled with this concept. Here’s what we added to help.” That builds trust and shows you’re listening.
Another trap: using analytics to punish. If you flag students who haven’t logged in for three days and send them a stern email, you’re not helping-you’re alienating. Use data to support, not shame.
Tools That Make This Practical
You don’t need a data science team. Here are three tools that work for instructors without coding skills:
- Canvas Insights: Built into most institutions’ LMS. Shows student activity, assignment trends, and risk flags. Easy to use, no setup needed.
- Google Analytics for Learning: Free plugin for any course hosted on a website. Tracks time on page, scroll depth, and exit points. Great for self-paced courses.
- EdPuzzle: For video-based content. Shows exactly where students pause, rewind, or answer incorrectly. Instant feedback on confusing moments.
These tools don’t replace your judgment-they amplify it. You’re still the expert. The data just tells you where to focus.

What Happens When You Get It Right
At a community college in Texas, an introductory biology course had a 42% failure rate. The instructor started using learning analytics and found three key issues:
- Students were dropping after the first lab simulation because the instructions assumed prior software knowledge.
- Discussion posts were mostly one-liners because prompts weren’t specific enough.
- Students who watched the video summaries scored 28% higher on exams.
She fixed them:
- Added a 3-minute walkthrough video for the simulation tool.
- Replaced “Discuss cell division” with “Compare mitosis and meiosis using the diagram from Module 4. What’s the biggest difference in outcomes?”
- Embedded video summaries at the end of every module.
One semester later, the failure rate dropped to 17%. More importantly, student feedback shifted from “This course was overwhelming” to “I finally understood how this all connects.”
Start Small. Think Big.
You don’t need to overhaul your course. Pick one module. Look at the data. Ask one question: “Why are students stuck here?” Then make one small change. Wait a week. Check again.
Learning analytics isn’t about having all the answers. It’s about asking better questions than before. It’s about replacing guesswork with evidence. And it’s the only way to make sure your course doesn’t just exist-it actually helps people learn.
What’s the difference between learning analytics and educational data mining?
Learning analytics focuses on real-time, actionable insights to improve teaching and learning right now. Educational data mining is more about discovering hidden patterns across large datasets over time, often using statistical modeling. Think of it this way: learning analytics tells you what to fix in your course next week. Educational data mining tells you why that fix worked-or didn’t-across 100 similar courses.
Do I need permission to collect student data for learning analytics?
Yes. Under FERPA in the U.S., student education records-including learning activity data-are protected. You must inform learners that their engagement data will be used to improve the course, and you can’t use it for grading, hiring, or disciplinary purposes without explicit consent. Most institutions have an IRB or data governance policy-check with your admin before collecting anything new.
Can learning analytics help with equity in education?
Absolutely. Analytics can reveal hidden disparities. For example, if students from certain backgrounds consistently drop out after the first discussion board, it might mean the prompts assume cultural knowledge they don’t have. Or if non-native English speakers spend twice as long on readings but score the same, they’re working harder for the same result. Data doesn’t lie-it shows where support is needed most.
How often should I check learning analytics data?
Check weekly during active course delivery. Look for sudden drops in engagement, spikes in assignment lateness, or changes in quiz performance. Don’t wait until the end of the term. The goal is to adjust while students are still in the course, not after they’ve already left.
What if my course platform doesn’t have analytics built in?
Start simple. Use free tools like Google Forms for quick check-ins: “On a scale of 1-5, how clear was this week’s material?” or “What’s one thing you’re still confused about?” Collect responses anonymously. You’ll get qualitative data that’s just as valuable as clickstream logs. Over time, move to platforms that offer basic analytics-many are free for educators.
Next Steps: Your 7-Day Action Plan
- Day 1: Pick one module with the lowest completion rate.
- Day 2: Pull the analytics for that module. Look at time spent, video replays, quiz attempts.
- Day 3: Identify the one behavior that stands out-like high drop-off after a video or low forum participation.
- Day 4: Make one small change. Add a prompt, shorten a video, or clarify instructions.
- Day 5: Tell students: “We noticed some of you had trouble here. We made a small change to help.”
- Day 6: Check the data again. Did the change help?
- Day 7: Repeat with another module. Small changes add up.
Learning analytics isn’t magic. It’s just paying attention-with tools. And when you do, you stop guessing what students need. You start knowing it.
Honey Jonson
November 22, 2025 AT 07:21Destiny Brumbaugh
November 23, 2025 AT 06:39Sara Escanciano
November 23, 2025 AT 18:52Elmer Burgos
November 24, 2025 AT 13:58Jason Townsend
November 26, 2025 AT 00:00Antwan Holder
November 26, 2025 AT 19:51Aryan Gupta
November 28, 2025 AT 17:18Fredda Freyer
November 29, 2025 AT 03:08Gareth Hobbs
November 29, 2025 AT 08:03Zelda Breach
November 29, 2025 AT 12:31