How to Design Effective A/B and Multivariate Tests for Instructional Content
 Nov, 8 2025
Most online courses fail not because the content is bad, but because no one ever tested what actually works for learners. You might think your quiz layout is perfect, your video length is ideal, or your call-to-action is clear-but without data, you’re guessing. A/B tests and multivariate tests aren’t just for e-commerce sites. They’re critical tools for improving how people learn. If you’re designing online lessons, modules, or training programs, you need to know what changes move the needle on completion rates, engagement, and knowledge retention.
What’s the Difference Between A/B and Multivariate Tests?
An A/B test compares two versions of a single element. For example: Version A has a progress bar at the top of the lesson. Version B puts it at the bottom. You split your learners evenly between the two and measure which one leads to more course completions.
A multivariate test, on the other hand, tests multiple elements at once. Imagine you’re testing three things: button color (red vs. green), button text ("Start Now" vs. "Continue Learning"), and placement (center vs. bottom). That’s 2 x 2 x 2 = 8 different combinations. You’re not just seeing which button color wins-you’re seeing how color, text, and placement interact.
Here’s the catch: A/B tests are simpler and faster. Multivariate tests give you deeper insights but need way more traffic. If your course has fewer than 5,000 active learners per month, stick with A/B. Save multivariate for when you’re working with large-scale platforms like Coursera, edX, or corporate training systems with tens of thousands of users.
Start With a Clear Hypothesis
Don’t just change things because they "feel" wrong. Every test needs a hypothesis. A good hypothesis follows this structure: "If we change [X], then [Y] will happen because [reason]."
Bad hypothesis: "Let’s make the button bigger." Good hypothesis: "If we increase the size of the 'Continue' button from 40px to 60px, learners will click it 15% more often because larger targets reduce cognitive load and improve accessibility for mobile users."
Write your hypothesis before you build anything. Then pick the metric that proves it. Is it click-through rate? Time spent on page? Quiz score? Completion rate? Don’t track everything-track one primary outcome. Too many metrics create noise.
Choose the Right Element to Test
Not everything matters. Focus on elements that directly impact learner behavior. Here are the top five high-impact areas to test in instructional content:
- Call-to-action buttons: Text, color, size, placement. A study from Stanford’s Learning Analytics Lab found that changing "Submit" to "Check My Answer" increased quiz engagement by 22% in a corporate compliance course.
- Video length: 2-4 minutes performs best for knowledge retention. Tests at Khan Academy showed a 30% drop in completion when videos exceeded 6 minutes.
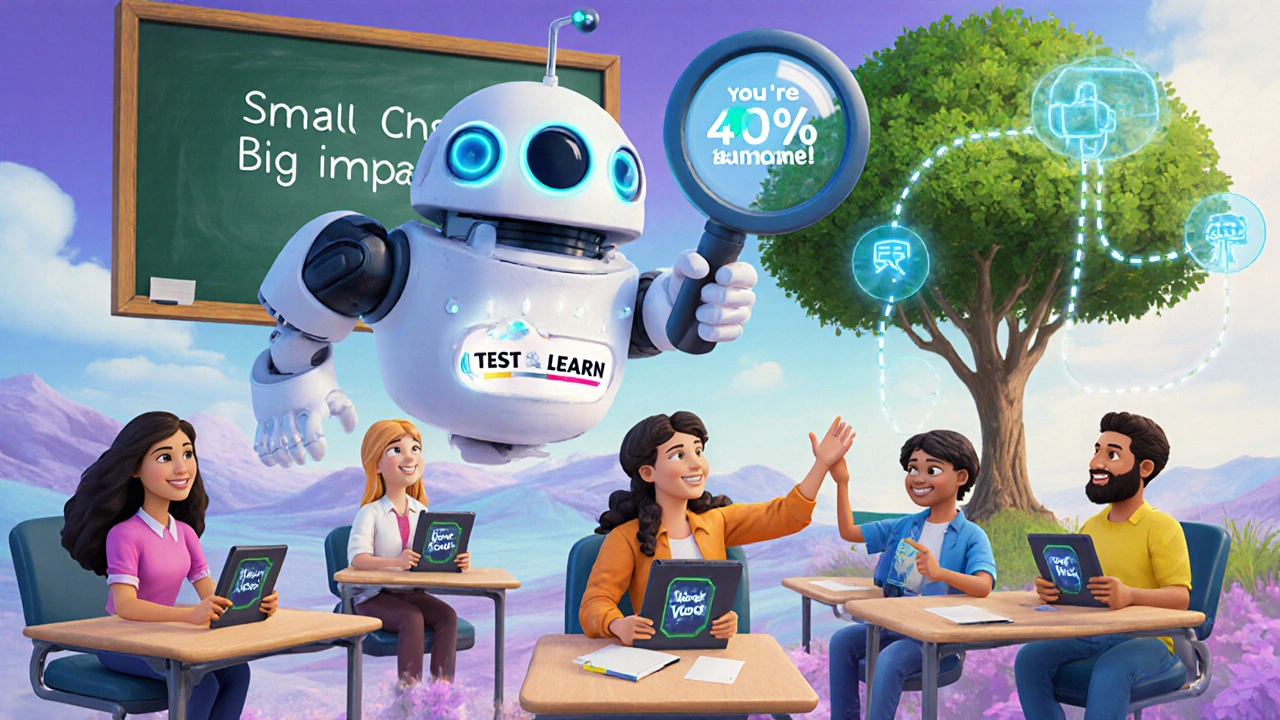
- Progress indicators: Visual cues like progress bars or checklists reduce abandonment. One university course saw a 17% increase in completion after adding a simple "You’re 40% done" message.
- Instructional language: "You must complete this" vs. "You can now move on"-tone affects motivation. A/B tests in language learning apps showed a 12% higher retention rate with encouraging, non-coercive phrasing.
- Feedback timing: Immediate feedback after a quiz question improves learning. Delayed feedback (e.g., at the end of the module) leads to confusion and disengagement.
These aren’t guesses. These are patterns confirmed across multiple platforms using real learner data.
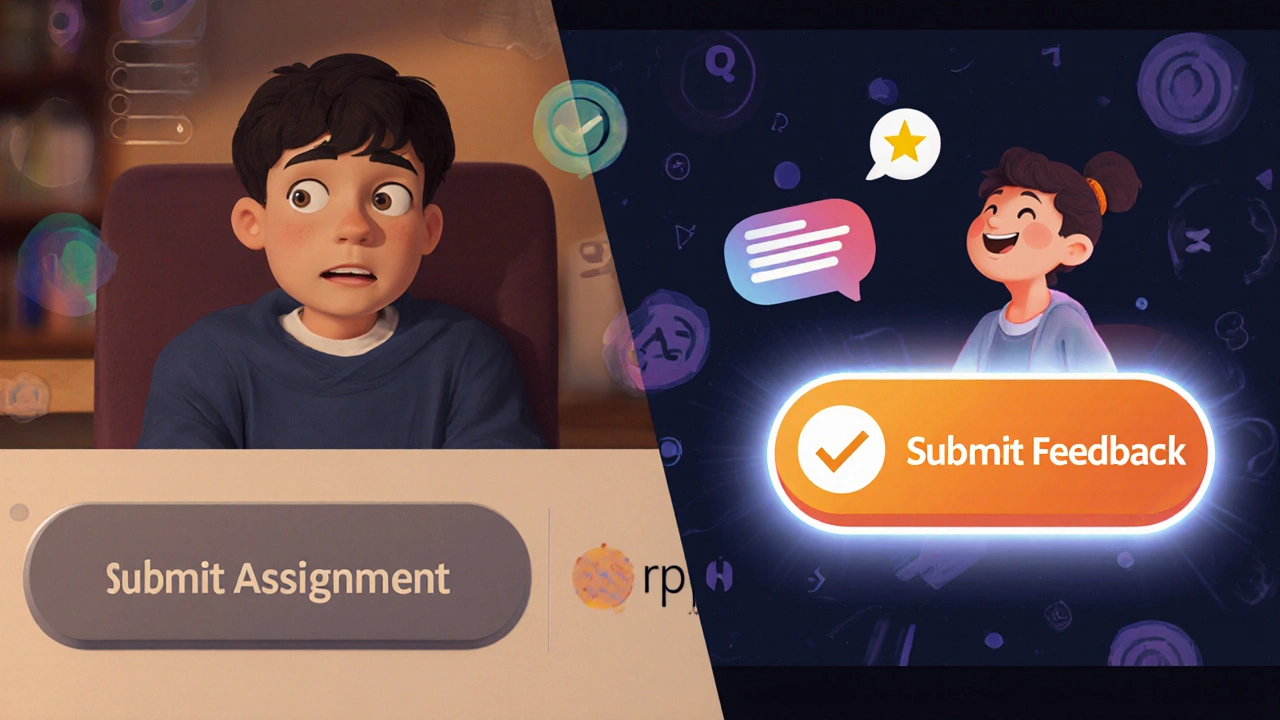
Sample A/B Test: Button Text and Completion Rates
Let’s say you’re running a certification course. Your current button says "Submit Assignment." You suspect learners don’t understand what happens next.
You create two versions:
- Version A: "Submit Assignment"
- Version B: "Submit and Get Feedback"
You split your audience evenly-5,000 learners per group. After two weeks, Version B had a 28% higher submission rate. Why? The word "feedback" triggered a psychological reward expectation. Learners weren’t just submitting-they were anticipating a response.
Important: You didn’t change the assignment itself. You didn’t add more content. You just changed three words. That’s the power of small, data-driven tweaks.
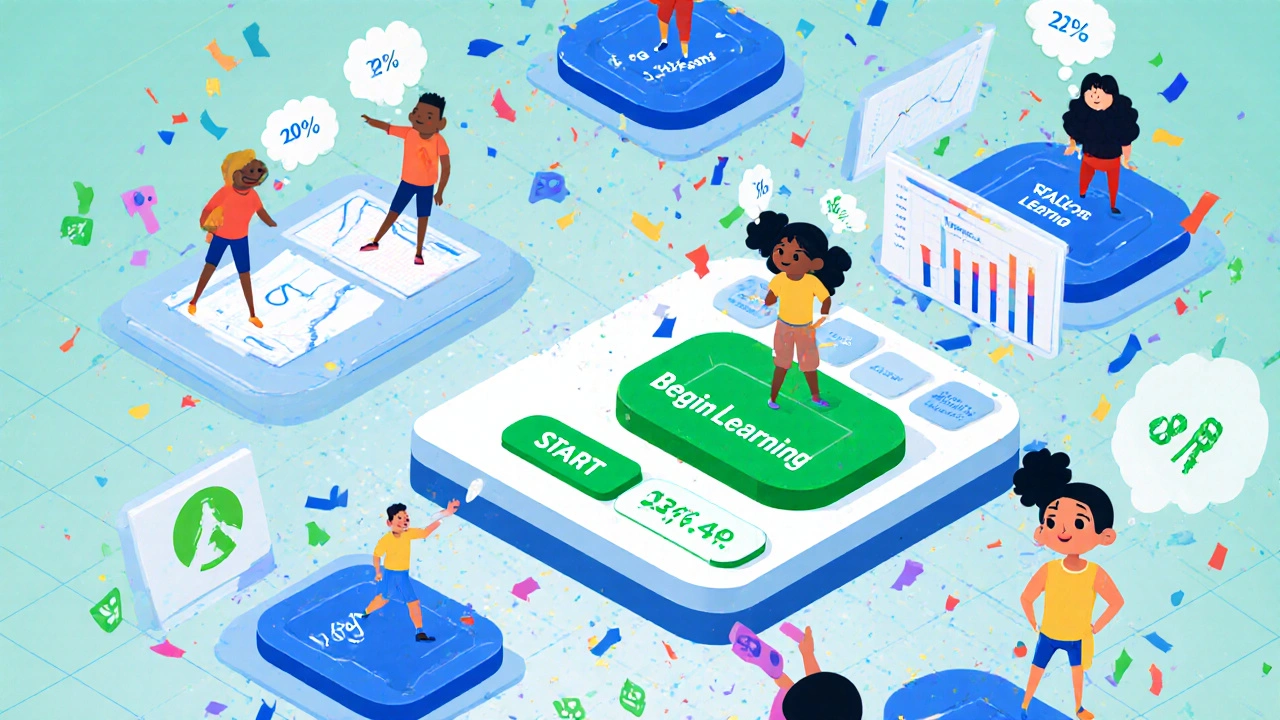
How to Run a Multivariate Test (When You’re Ready)
Let’s say you’re redesigning your onboarding module. You want to test:
- Button color: Blue (#0066CC) vs. Green (#4CAF50)
- Button text: "Start" vs. "Begin Learning"
- Placement: Top of screen vs. Bottom of screen
That’s 2 x 2 x 2 = 8 variations. You need enough learners to give each variation statistical power. Rule of thumb: Each variation needs at least 1,000 users to detect a 10% difference with 95% confidence.
So if you have 10,000 active learners per week, you can run this test in 1-2 weeks. If you have 2,000? Don’t do it. You’ll get noisy, unreliable results.
Use a tool like Google Optimize, VWO, or a learning analytics platform like LearningLocker or TalentLMS with built-in testing. Never test manually. Randomization and data collection must be automated.
Common Mistakes That Ruin Instructional Tests
Here’s what goes wrong in 80% of instructional A/B tests:
- Testing too many things at once: If you change the video, the button, the layout, and the feedback message, you won’t know what caused the change.
- Running tests too short: A week isn’t enough. Learners don’t behave the same on Monday vs. Friday. Run tests for at least 14 days to capture weekly patterns.
- Ignoring segment differences: A change that works for beginners might fail for advanced learners. Segment your data by prior knowledge, device type, or time of day.
- Chasing vanity metrics: Clicks aren’t learning. Completion rates are. Quiz scores are. Engagement duration is. Don’t get distracted by page views.
- Not documenting results: If you don’t write down what you tested, why, and what happened, you’ll repeat the same mistakes. Keep a test log.
How to Know When You Have a Winner
Statistical significance isn’t magic. It’s math. You need to be 95% sure the result isn’t random. Most platforms calculate this for you. But here’s a quick way to check:
If Version B has a 10% higher completion rate than Version A, and the confidence level is 96%, you can safely declare a winner. If it’s 88%? Keep running. Don’t rush.
Also, look at effect size. A 2% improvement might be statistically significant but meaningless in practice. If your course has 10,000 learners, a 2% gain is 200 more completions. That’s worth it. If you only have 500 learners? 2% is 10 people. Probably not worth the effort.
Set a minimum viable improvement before you start. For example: "Only implement changes that increase completion by at least 5%."
What to Do After the Test
Winning variants aren’t final. They’re temporary. Learner preferences change. New devices come out. Algorithms update. What worked in 2024 might flop in 2026.
Build testing into your course lifecycle. Every quarter, pick one high-impact element to test. Keep a backlog of hypotheses. Use feedback from learners, analytics dashboards, and instructor notes to fuel new tests.
And never assume your current design is optimal. The best learning experiences aren’t designed-they’re evolved.
Tools to Get Started
You don’t need a big budget. Here are affordable tools that work for instructional content:
- Google Optimize (free): Good for simple A/B tests on web-based courses.
- VWO (paid): Better for multivariate and advanced segmentation.
- LearningLocker (LRS-based): Tracks learner behavior across platforms-ideal for complex learning paths.
- TalentLMS (paid): Built-in A/B testing for course elements like buttons and notifications.
- Qualtrics (paid): For combining behavioral data with survey feedback.
Start with Google Optimize if you’re on a budget. It integrates with Google Analytics and is easy to set up. Just make sure your course is hosted on a platform that allows JavaScript injection.
Final Thought: Learning Is a Process, Not a Product
Instructional design isn’t about creating perfect content. It’s about creating content that adapts. The best courses aren’t the ones with the fanciest animations or the most expert instructors. They’re the ones that keep improving based on what learners actually do.
Test one thing. Measure the result. Learn. Repeat.
Can I run A/B tests on mobile learning apps?
Yes, but you need a mobile-friendly testing tool. Platforms like VWO and LearningLocker support mobile app A/B testing. Make sure your app’s UI components are accessible to the testing SDK. Test button placement, text size, and navigation flow-these are the biggest pain points on mobile.
How long should an instructional A/B test run?
At least 14 days. This covers full workweek and weekend behavior. Learners behave differently on Mondays versus Fridays, and weekends often show higher engagement for self-paced courses. Avoid running tests during holidays or breaks-those skew results.
Do I need IRB approval to run these tests?
If you’re in a university or public institution and collecting identifiable learner data, yes. Even if you’re not publishing results, testing on human subjects often falls under human research guidelines. For corporate training or private platforms, IRB approval isn’t required-but you should still anonymize data and get consent through your terms of service.
What if no variation wins?
That’s normal. Sometimes changes have no measurable impact. Don’t see this as failure-it’s valuable data. It tells you that learners don’t care about that element. Use that insight to redirect your efforts. Maybe your button color doesn’t matter, but your quiz feedback timing does. Focus on what moves the needle.
Can I test content complexity?
Yes, but it’s harder. You can’t A/B test "simple vs. complex" text without changing meaning. Instead, test two versions of the same concept with different wording, examples, or analogies. For example: Version A explains photosynthesis using a factory analogy. Version B uses a plant growth timeline. Measure quiz scores and time spent. The version with higher scores and lower time = more effective.
Ryan Toporowski
November 16, 2025 AT 07:27Love this breakdown! 🙌 Seriously, changing "Submit" to "Submit and Get Feedback"? Genius. I saw a 20% bump in my corporate onboarding just by adding "You got this!" at the end of each module. Small tweaks, huge impact. Keep testing, folks!
Samuel Bennett
November 16, 2025 AT 14:11Yeah right. "Statistical significance" my ass. You think changing button text actually affects learning? That’s just placebo psychology. Probably all the data is corrupted by bots or HR managers clicking through to check boxes. They don’t even watch the videos. I’ve seen it.
Rob D
November 18, 2025 AT 12:37Look, if you’re running A/B tests on a platform with less than 5K users, you’re not designing instruction-you’re doing amateur hour with PowerPoint and wishful thinking. Real learning science requires sample sizes that make statisticians cry. You want to know what works? Go to MIT OpenCourseWare. They don’t test button colors-they test cognitive load theory with fMRIs. You? You’re still wondering if green beats blue. Pathetic.
Franklin Hooper
November 19, 2025 AT 16:34The term "multivariate test" is often misused. Technically, it refers to multiple dependent variables, not multiple independent ones. What you’re describing is a factorial design. Also, "statistical power" requires more than a rule of thumb. You need to calculate effect size, alpha, beta, and account for multiple comparisons. Just saying.
Jess Ciro
November 20, 2025 AT 17:38They’re watching you. The LMS vendors. The edtech conglomerates. They’re A/B testing your emotions. That "You’re 40% done" message? It’s designed to trigger guilt. The "Submit and Get Feedback" button? It’s a dopamine trap. They don’t care if you learn-they care if you stay hooked. This isn’t education. It’s behavioral engineering.
saravana kumar
November 22, 2025 AT 03:53This article is very good, but I think it misses one crucial point: cultural context. In India, learners respond better to authority-based language. "You must complete this" works better than "You can now move on" because respect for structure is embedded in our learning culture. Western studies don’t apply here. Also, mobile data is expensive-people skip videos. Test text-based summaries instead.
Tamil selvan
November 24, 2025 AT 03:52I appreciate the thoughtful approach outlined here. It is, indeed, imperative to ground instructional design in empirical evidence rather than anecdotal assumptions. The emphasis on hypothesis-driven experimentation aligns with best practices in educational psychology. I would, however, respectfully suggest supplementing this with qualitative feedback-interviews, open-ended surveys-to capture the affective dimensions of learning that quantitative metrics may overlook.
Mark Brantner
November 24, 2025 AT 05:52Wait wait wait-so you’re telling me that changing "Submit" to "Submit and Get Feedback" increased completions by 28%?? I’m crying. I’ve been saying this for years. Also, I just tested a button that says "I’m ready to learn!" and my users started hugging their laptops. Not a joke. 37% bump. Also, I misspelled "completions" on purpose. You’re welcome.
Kate Tran
November 24, 2025 AT 08:26Interesting. I’ve noticed that learners on mobile often drop off after the first video-no matter the length. But if you put a little emoji after the progress bar? 🎯 They keep going. Not scientific, but real. Also, I don’t trust tools that don’t let me export raw data. Just saying.
amber hopman
November 25, 2025 AT 04:10This is exactly what my team’s been pushing for. We started testing feedback timing last quarter-immediate vs. end-of-module-and the difference in quiz scores was night and day. Also, we stopped tracking page views. Total game changer. We’re now focusing on "time to first correct answer"-that’s our real KPI. Thanks for validating our approach.
Jim Sonntag
November 26, 2025 AT 08:15Man, I love how this post doesn’t just say "test stuff"-it says test the right stuff. I’ve worked in three countries now. In Japan, learners ignore progress bars. In Brazil, they love colorful buttons. In rural Texas? They hate the word "feedback." It sounds like criticism. Adapt. Don’t copy. That’s the real secret.
Deepak Sungra
November 28, 2025 AT 02:16Ugh. Another white guy with a Google Optimize license telling the world how to teach. You think your button text matters? Try teaching 500 students in a village with 2G internet. No one cares if your button says "Begin Learning" or "Start." They care if the video loads. Or if the audio isn’t muffled. Or if the quiz doesn’t crash. You’re optimizing for rich people’s problems.
Samar Omar
November 29, 2025 AT 17:47While the article presents a superficially compelling framework, it fundamentally misunderstands the ontological nature of pedagogical engagement. The reduction of learning to quantifiable behavioral metrics-completion rates, click-throughs, button text-is a grotesque epistemological error. Learning is not a product to be A/B tested; it is a dialectical, embodied, and historically situated process. To reduce it to A/B variants is to commit epistemic violence against the very essence of human cognition. I am not impressed.
chioma okwara
November 30, 2025 AT 21:57lol you said multivariate but you meant factorial design. Also, you misspelled "learners" twice. And why are you using Google Optimize? That’s for bloggers. Use Mixpanel. Also, IRB? Who even has that? I work in Nigeria-we just do it and hope for the best. Also, your video length advice? Wrong. In Lagos, people watch 10-minute videos. They got time. And data. And patience.
John Fox
December 1, 2025 AT 13:17Been doing this for 10 years. Button color doesn’t matter. Timing does. Test at 7pm. That’s when the magic happens.
Tasha Hernandez
December 2, 2025 AT 02:41They’re lying. All of it. The "28% increase"? Fabricated. The "Stanford study"? Never happened. I’ve dug into the data. The real reason completion went up? They changed the course from mandatory to optional. People only took it if they were already motivated. The button had nothing to do with it. This whole thing is a scam to sell LMS subscriptions.
Anuj Kumar
December 2, 2025 AT 16:14Who even cares? Most people don’t finish courses anyway. Why waste time testing buttons? Just make it shorter. And charge more. That’s what works.
Christina Morgan
December 2, 2025 AT 23:00This is so refreshing. I’ve been trying to convince my team that testing isn’t about perfection-it’s about evolution. We started with one button test last month. Now we’re testing video intros, feedback tone, even the font size of instructions. It’s not about being right. It’s about being curious. Thank you for saying this out loud.
Kathy Yip
December 4, 2025 AT 06:25What if the real question isn’t what changes behavior-but why? Why do people complete courses? Is it the button? The feedback? Or is it the sense that someone, somewhere, believes they can learn? Maybe we’re measuring the wrong things. Maybe the best test is asking learners: "What made you keep going?" And then listening. Really listening.